
 JVM Research & Technology
Making Ideas Happen
Engineering Consulting and Research
✻ Display Metrology and Electrical Engineering ✻
Engineering, Research, and Technology for displays and analog-dominant and mixed signal electronic products
JVM Research is an electrical engineering / electronic display engineering and research organization available for consulting, contracting, or collaboration for projects. We specialize in analog engineering and displays, but also mixed signal systems. Whether you are looking for assistance for display development or analysis, analog design or testing, or general engineering consulting, we can help.
Some Areas of Expertise from JVM Research
- Display Analysis, Metrology, and Standards
- Display Measurement and Characterization
- Standards involvement to help make the methods used standardized for all in the industry to use.
- Circuit Design
- Circuit Analysis
- Signal Integrity / Signal analysis
- Thermal Analysis
- Data Analysis & Visualization
- Standardization Development
- Great Deal of Foreign Experience
- Project Engineering & Management
- Peripheral Services
- Graphics Design
- Web Site Design
- Agency/Regulatory Qualification and Compliance Design
Display Engineering and Metrology area of the web site
Electrical Engineering and Design area of the web site
Examples of graphics and visualizations from JVM Research
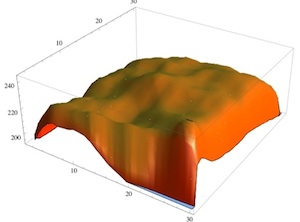 |
31x31 point luminance plot. A surface plot of 31 rows of luminance on a display where each row was measured in 31 points across. |
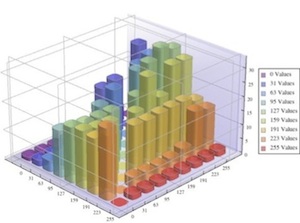
| For an 8bit/color display, there are 28 gray levels, or 255 (256 total levels, but the count starts at 0, not 1). This bar plot is a visualization of data taken for inter-gray level or gray-to-gray response time, for 9 equally spaced gray levels, where each of the levels was a beginning or ending level for the measurements. The levels are 0, 31, 63, 95, 127, 159, 191, 223, 255. |
 |
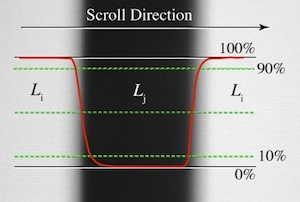 |
Visualization of a scrolling box on an LCD display, showing motion blur, and how a waveform which represents the magnitude of the luminance (from black to bright level) with respect to the spatial displacement on the display. |
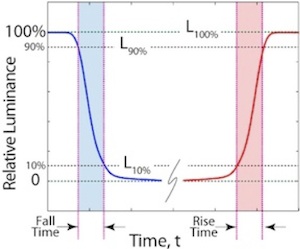
| A plot of measured fall time / rise time for a falling and rising step response. The visualization shows the 100% point and the 0 point, and the 10% and 90% points — the points most commonly used as reference to determine the time of the step. While this particular example was measured for a temporal luminance change on a display, it is similar to step responses that would also be measured for electrical signals. |
 |
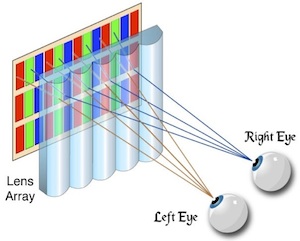 |
Drawing of a Lenticular Lens Array Autostereoscopic systems, partial view. The micro-lens system steers the light path to allow each eye to see different regions of the display behind the lenses. Developed for the 3D / Stereo display work of the IDMS. |
 |
|
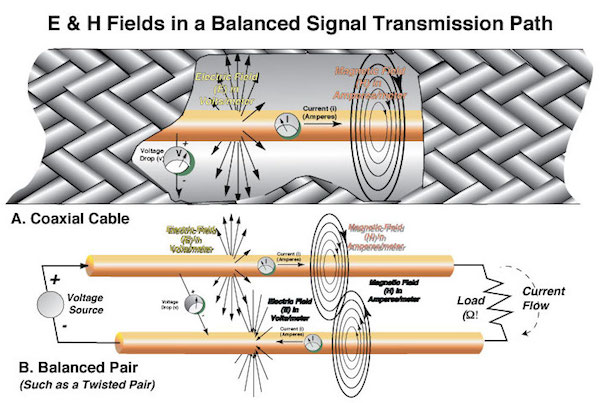
| From a presentation at ISHM Advanced Technology Workshop on Flat Panel Display Packaging in 1995, entitled "EMI Issues for Flat Panel Displays." EMI Presentation Link |
|